

Hard numbers from campaigns that moved revenue.
Every case study here is anchored to a single north-star metric — CAC, revenue lift, or conversion rate. No creative awards. No vanity impressions.


Six industries. One standard: measurable CAC.
CAC down 38%. Revenue up $2.1M in one quarter.
A mid-market DTC brand was paying $94 to acquire a $60 LTV customer. We rebuilt the funnel — attribution, creative rotation, and bid strategy — and dropped acquisition cost to $58 within 90 days.
North-star metric: Customer Acquisition Cost. Channels: Meta + Google integrated funnel with first-party data feed.
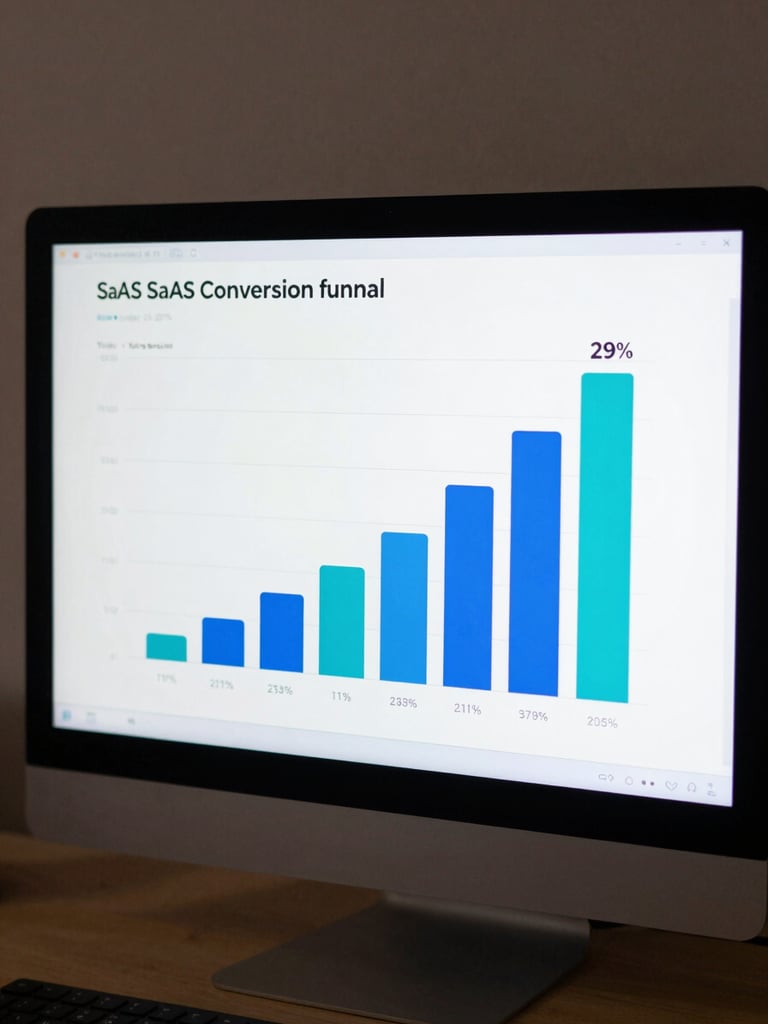
Trial-to-paid conversion lifted from 11% to 29%.
A B2B SaaS product had strong trial signups but a leaking mid-funnel. We mapped attribution from ad click to paid seat, rebuilt the onboarding nurture sequence, and doubled conversion inside two months.
North-star metric: Trial-to-paid rate. Channels: LinkedIn demand gen + email automation + in-app retargeting.
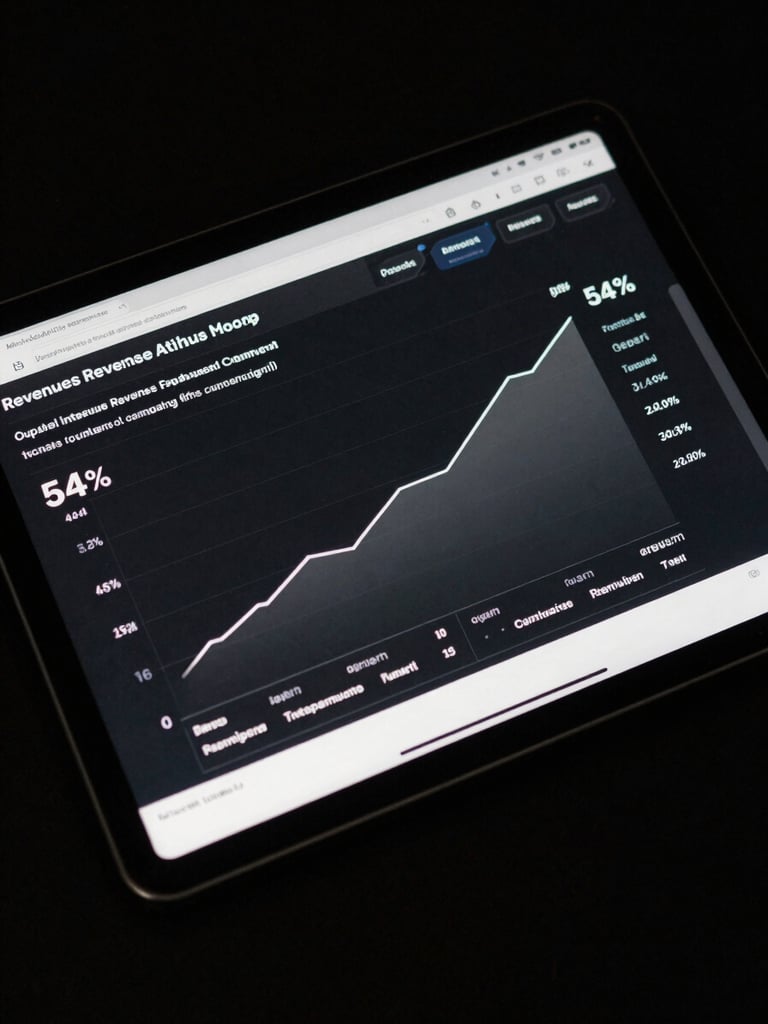
54% revenue lift attributed directly to integrated spend.
A regional retail chain was running disconnected Google and social campaigns with no shared attribution. We unified tracking, launched a geo-targeted funnel, and tied every dollar of ad spend to in-store and online revenue.
North-star metric: Attributed revenue per campaign dollar. Channels: Google Local + Meta + SEO content cluster.
Revenue moved. Dashboards don't lie.
We finally stopped guessing which channel was driving customers. MOOC gave us a single dashboard that tied every dollar of spend to a closed deal. CAC dropped 41% in the first quarter.
Our trial-to-paid rate had been stuck at 12% for eight months. Within 60 days of MOOC rebuilding our funnel, we were at 27%. The attribution reporting alone changed how we budget.
We had three agencies before MOOC. None of them could show us where the revenue came from. MOOC built the attribution layer first, then ran the campaigns. That order matters.
Your revenue target is the brief.
Tell us the number you need to move. We'll show you the three levers we'd pull and the dashboard that proves we pulled them.